What Is the Largest Contentful Paint?
Largest Contentful Paint (LCP) is a user experience (UX) metric that measures the time it takes for the largest content element (such as an image or text block) on a page to appear on the screen after the browser starts loading the page. LCP is one of the Core Web Vitals, a set of three metrics Google uses to evaluate a website’s performance in terms of UX. The other two metrics are:
- First Input Delay (FID): The time it takes for the page to respond when a user interacts with it.
- Cumulative Layout Shift (CLS): The measure of how much the page layout shifts unexpectedly while loading.
These metrics are interconnected, with each one impacting the others. For instance, a high LCP could lead to a high FID because the browser cannot respond to user input until the LCP element loads.
Largest Contentful Paint vs. First Contentful Paint
Don’t mix up Largest Contentful Paint (LCP) with First Contentful Paint (FCP); they are distinct metrics.
LCP measures the time it takes for the largest element on the page to load, whereas FCP measures the time from when the page starts loading to when the first visual element (which might not be the largest) appears on the screen.
LCP is a more accurate indicator of when a web page is ready for user interaction. In contrast, FCP can be misleading because the first element loaded might be something minor, like an empty image tag, rather than the main content of the page.
Why Is LCP Important for Website Performance?
People expect websites to load quickly, and improving your Largest Contentful Paint (LCP) score ensures your site loads faster and is ready for user interaction sooner. A better LCP score can lead to several benefits:
- Higher Rankings: As part of the Core Web Vitals, LCP influences Google’s ranking of your website. Enhancing your LCP can boost your site’s rankings, driving more traffic and revenue.
- Lower Bounce Rates: Faster loading times reduce the likelihood of impatient visitors leaving your site prematurely.
- Increased Conversion Rates: A faster website generally leads to higher conversion rates.
LCP is crucial because it represents the time it takes for the largest element to become visible in the viewport, which is typically above the fold (at the top of the page). This element can be an image, text block, video, or animation, and it may vary between mobile and desktop views. The largest element is the most relevant for user experience and perceived load speed. If the largest element doesn’t load quickly, users might see an almost blank page and could leave the site, negatively impacting user experience.
Google includes LCP as one of the Core Web Vitals metrics to measure user experience quality. Starting in June, LCP will be part of the new ranking factor, the Page Experience Signal, making it important not only for user experience but also for SEO performance. Additionally, LCP accounts for 25% of the overall PageSpeed Insights score, so improving LCP performance can enhance your page speed grade. In summary, LCP is one of the most critical performance metrics today.
What Is a Good LCP Score?
Largest Contentful Paint (LCP) is measured in seconds. A good LCP score is 2.5 seconds or less, which is necessary to pass Google’s Core Web Vitals check and earn a green score.
If your LCP score falls between 2.5 and 4 seconds, your website speed needs improvement, and you’ll receive an orange grade.
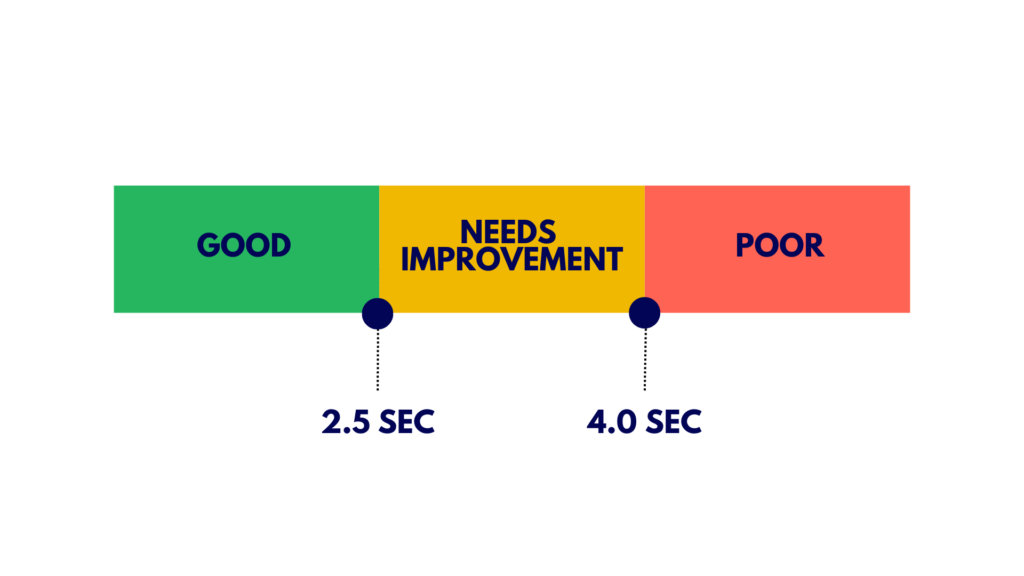
An LCP score of more than 4 seconds indicates poor website speed, requiring significant improvement to avoid a red score.
In summary:
- Good LCP (≤ 2.5 seconds): Green score, passes assessment.
- Needs Improvement (2.5 – 4.0 seconds): Orange score.
- Poor (> 4 seconds): Red score, needs urgent fixing.
What Factors Affect Largest Contentful Paint and Cause a Slow Score
Four factors can lower an LCP score:
- Slow Server Response Times When a server takes too long to respond to a browser request, the largest content elements take longer to render, negatively impacting the LCP score.
- Render-blocking JavaScript and CSS Certain scripts and stylesheets can block the process of displaying an HTML page, delaying the rendering of content. This affects LCP performance.
- Slow Resource Load Times High-definition images, videos, and block-level elements like HTML and CSS files can cause poor performance and a bad user experience, especially when these elements are above the fold.
- Client-side Rendering Using client-side rendering can result in slower load times, particularly when it involves a large amount of JavaScript or when content is loaded for the first time in a user’s browser.
How to Find and Measure the Largest Contentful Paint
Measuring Largest Contentful Paint (LCP) can be quick and painless with the right tools. Both Lab and Field Data methods are available to find and measure the LCP element. Here are some of the most popular tools you can use:
- PageSpeed Insights
- Lighthouse
- Chrome DevTools
- Search Console
- Semrush’s Site Audit Tool
Measuring and Finding LCP with PageSpeed Insights, Lighthouse, Chrome DevTools
PageSpeed Insights is an excellent tool for measuring and identifying the Largest Contentful Paint (LCP) element on your page.
After testing your URL, you’ll receive the LCP grade in both Lab Data and Field Data (if available), along with recommendations to improve your performance. To find the LCP element, navigate to the Diagnostics area and look for the “Largest Contentful Paint element” section.
Here are a couple of examples to illustrate:
LCP Example from Mobile
Let’s analyze a wepage from a mobile device. After testing the page’s performance, we go to the Diagnostics area. The LCP element is the background image, which is the image in the first section. As long as the main title loads quickly, the page will provide an excellent user experience.
LCP Example from Desktop
Now, let’s look at the same URL from a desktop. Again, we go to the Diagnostics area to find the LCP element. For desktop, the LCP is the transition colors of the H1, specifically at the “PERFECTLY” part.
Since PageSpeed Insights is a page-based tool, it’s recommended to run several tests for different pages. For a comprehensive analysis, you should also utilize the Search Console.
Understanding LCP metrics using PageSpeed Insights, Lighthouse, Chrome DevTools
Before optimizing Largest Contentful Paint (LCP), developers should first determine if there is an LCP issue and its extent. Understanding what is Largest Contentful Paint (LCP) and how to improve LCP is crucial for enhancing user experience.
LCP can be measured using various tools, but not all measure it the same way. To understand the LCP meaning for real users, it’s essential to look at real user data rather than relying solely on lab-based tools like Lighthouse. While these tools provide valuable insights for improving LCP, they may not fully represent the actual user experience.
Real User Monitoring (RUM) tools or the Chrome User Experience Report (CrUX) can provide LCP data based on real user experiences. These tools help identify the largest contentful paint element and any LCP load delay or LCP render delay. PageSpeed Insights offers access to CrUX data, showing what real users experience in the top section and more detailed lab-based data in the bottom section. If CrUX data is available, prioritize real user data.
To fix Largest Contentful Paint issues, developers should focus on both lab and field data. This approach helps in understanding how to improve Largest Contentful Paint effectively. By addressing LCP issues identified through real user data, developers can significantly enhance the performance and user experience of their websites.
- Using CrUX LCP data
Using CrUX data to analyze Largest Contentful Paint can help you understand and improve LCP performance. The top section of PageSpeed Insights, labeled “Discover what your real users are experiencing,” provides access to CrUX data, which is crucial for identifying real user LCP issues. The bottom section, labeled “Diagnose performance issues,” offers more detailed lab-based data. Always prioritize real user data if CrUX data is available for your website.
PageSpeed Insights displays up to four different types of CrUX data:
- Mobile data for the specific URL
- Desktop data for the specific URL
- Mobile data for the entire origin
- Desktop data for the entire origin
You can toggle these options in the controls at the top and top right-hand side of the section. If a URL lacks sufficient data, PageSpeed Insights will show origin data instead.
The LCP for the entire origin may differ significantly from an individual page’s LCP due to how the largest contentful paint element is loaded and how visitors navigate to these pages. Home pages, often visited by new users, may load “cold” without cached content, resulting in slower performance.
Examining the four different categories of CrUX data can help you determine whether an LCP issue is specific to a particular page or more general across the site. It can also reveal which device types are experiencing LCP load delay or LCP render delay.
Understanding what is Largest Contentful Paint and how to improve Largest Contentful Paint is essential for optimizing your website’s performance. By focusing on real user data and addressing identified LCP issues, you can effectively improve LCP and enhance the overall user experience.
- Using CrUX supplementary metrics
To optimize the Largest Contentful Paint (LCP), it’s essential to consider supplementary metrics from PageSpeed Insights CrUX, such as First Contentful Paint (FCP) and Time to First Byte (TTFB). These metrics provide valuable insights into LCP performance.
Time to First Byte (TTFB) measures the time from when a visitor starts navigating to a page until the first bytes of the HTML document are received. A high TTFB can make achieving a 2.5-second LCP challenging or even impossible. Factors contributing to a high TTFB include multiple server redirects, visitors located far from the nearest server, poor network conditions, or an inability to use cached content due to query parameters.
Once a page starts rendering, the initial paint (e.g., background color) is followed by some content appearing (e.g., site header). This initial content appearance is measured by FCP. The delta between FCP and other metrics can be very telling.
A large delta between TTFB and FCP could indicate that the browser needs to download many render-blocking assets or complete significant work to render meaningful content, often seen in sites relying heavily on client-side rendering.
A large delta between FCP and LCP suggests that the LCP resource is either not immediately available for the browser to prioritize (e.g., text or images managed by JavaScript rather than being available in the initial HTML) or that the browser is completing other tasks before displaying the LCP content.
To improve LCP, focus on reducing server response times, optimizing images, and minimizing render-blocking resources. Understanding and addressing these factors can significantly enhance the LCP and overall user experience.
- Using PageSpeed Insights Lighthouse data
To improve the Largest Contentful Paint (LCP), the Lighthouse section of PageSpeed Insights offers valuable guidance. However, it’s crucial to first verify if the LCP data aligns with real user data from CrUX. If there’s a discrepancy between Lighthouse and CrUX, CrUX likely provides a more accurate representation of your user experience. Ensure your CrUX data is specific to your page, not the entire origin, before taking action.
If both Lighthouse and CrUX indicate that LCP values need improvement, the Lighthouse section can offer practical advice on how to fix Largest Contentful Paint issues.
In addition to the opportunities for improvement, Lighthouse provides diagnostic information that can help identify the root causes of LCP load delays and render delays. Understanding these diagnostics is key to effectively improving LCP performance
LCP breakdown
To ensure your webpage is lightning-fast, you need to focus on the Largest Contentful Paint (LCP). The goal is to get your LCP resource loading as soon as possible and have the LCP element render immediately after the resource is loaded. Here’s a breakdown of the key components that make up the total LCP time:
- Time to First Byte (TTFB): This is the time from when a user starts loading the page until the browser receives the first byte of the HTML document. Think of it as the initial handshake between your browser and the server.
- Resource Load Delay: This is the gap between receiving the first byte and starting to load the LCP resource. If your LCP element is something simple like a text node using a system font, this delay can be zero.
- Resource Load Duration: This is the actual time it takes to load the LCP resource. Again, if no resource load is needed, this duration is zero.
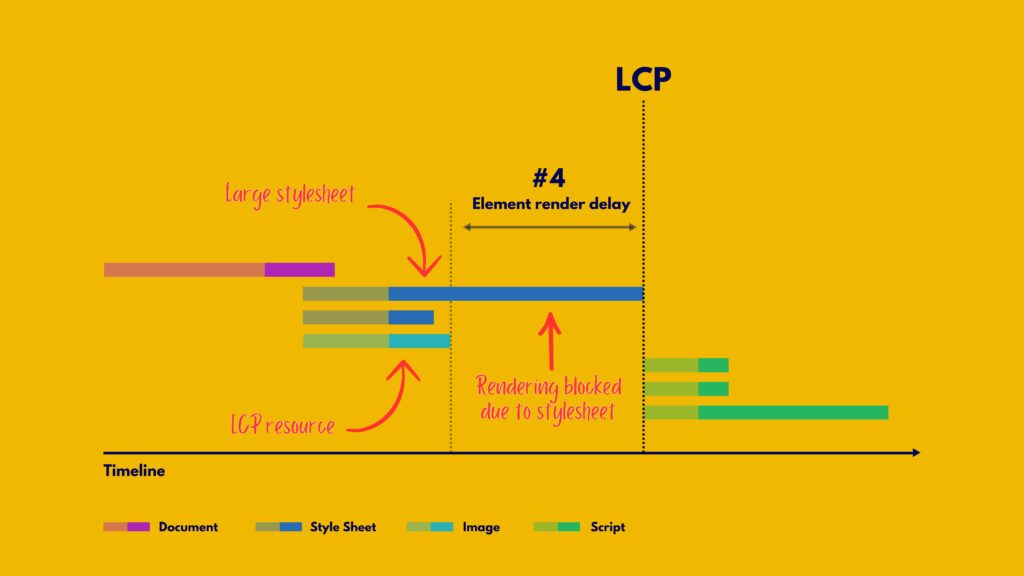
- Element Render Delay: This is the time from when the LCP resource finishes loading to when the LCP element is fully rendered on the screen.
Each of these steps seamlessly fits together to form the total LCP time, ensuring there’s no overlap or gaps. By optimizing each part, you can significantly improve your page’s performance and provide a better user experience.
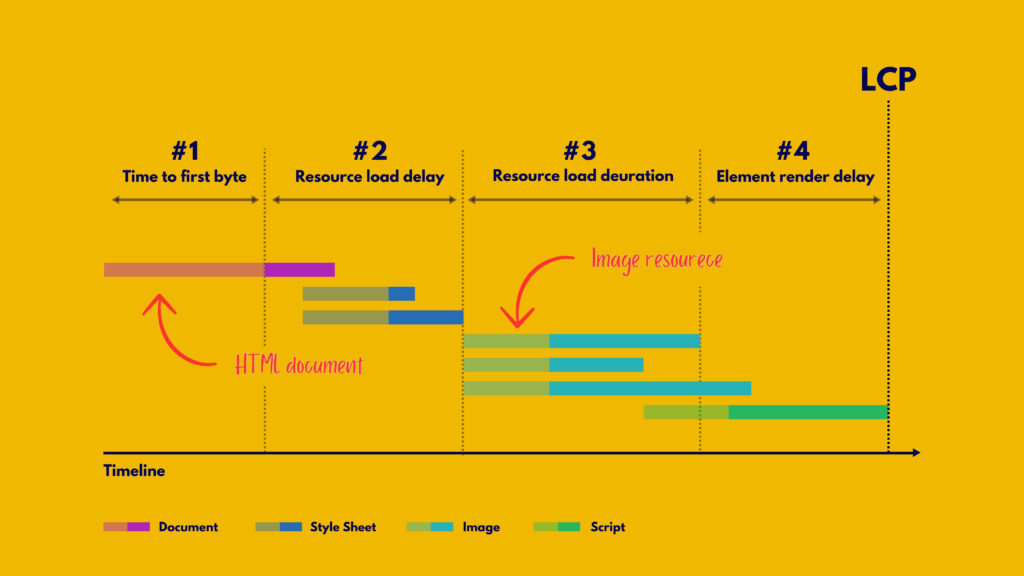
Every webpage’s Largest Contentful Paint (LCP) can be dissected into four distinct parts, each seamlessly following the other without any gaps or overlaps. Together, they form the complete LCP time.
When you’re fine-tuning your LCP, it’s beneficial to focus on optimizing each of these parts individually. However, remember that all parts need to be optimized collectively. Sometimes, tweaking one part might not reduce the overall LCP time but merely shift the saved time to another part.
For instance, imagine you compress an image to reduce its file size or switch to a more efficient format like AVIF or WebP. This would cut down the resource load duration, but it might not actually improve the LCP because the time saved would just move to the element render delay
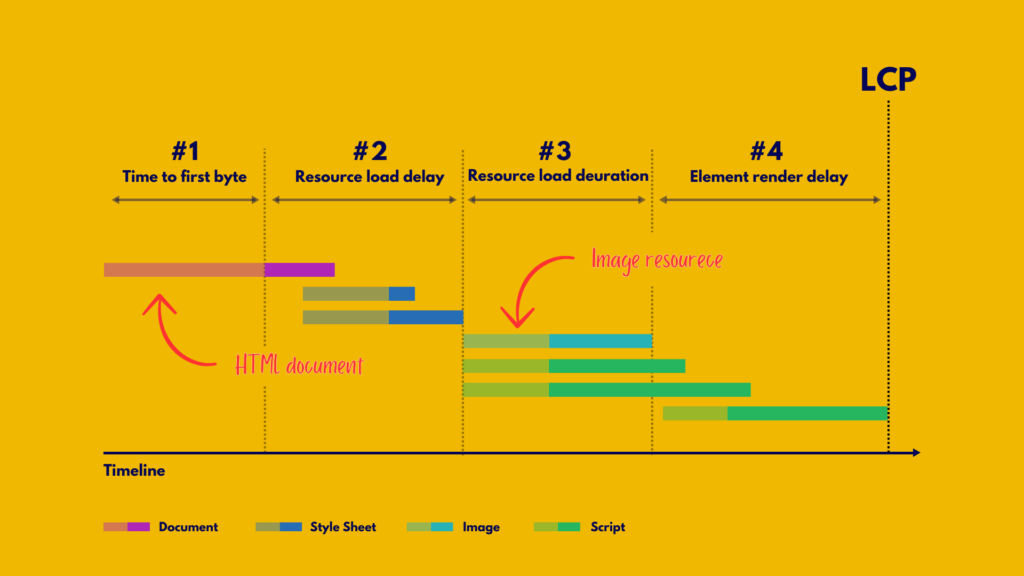
The reason this happens is that the LCP element on this page stays hidden until the JavaScript finishes loading, and then everything pops into view all at once.
This example perfectly highlights why it’s crucial to optimize each of these sub-parts to achieve the best LCP results.
How to Fix Largest Contentful Paint Issues
Now that you grasp how each segment of the LCP time should ideally break down on a well-optimized page, you’re ready to start fine-tuning your own pages.
In the following four sections, you’ll find top-notch recommendations and best practices for optimizing each part. These tips are arranged in order, starting with those likely to make the biggest splash.
1. Reduce time to first byte
The goal here is to get that initial HTML to the user as fast as possible. This step is often the trickiest because developers usually have the least control over it. But it’s super important since it impacts everything that follows. Nothing can happen on the frontend until the backend delivers that first byte of content. So, anything you can do to speed up your Time to First Byte (TTFB) will boost all your other load metrics too.
A common culprit for a slow TTFB on an otherwise speedy site is visitors arriving through multiple redirects, like from ads or shortened links. Always try to cut down on the number of redirects a visitor has to go through.
Another issue is when cached content can’t be used from a CDN edge server, and all requests have to go back to the origin server. This can happen if visitors use unique URL parameters for analytics, even if they don’t lead to different pages.
For more tips on optimizing TTFB, check out the optimize TTFB guide
2. Eliminate resource load delay
One big reason your Largest Contentful Paint (LCP) might be dragging is because of a slow server response time. To get a handle on this, you can check out your Time to First Byte (TTFB).
So, every time you want to load some content, your browser sends a request to the server. TTFB measures how long it takes for the server to send back the first byte of data. By boosting your TTFB, you’ll not only speed up your server response time but also improve your LCP score.
A good TTFB should be under 200 ms. You can easily check this by testing your site’s URL.
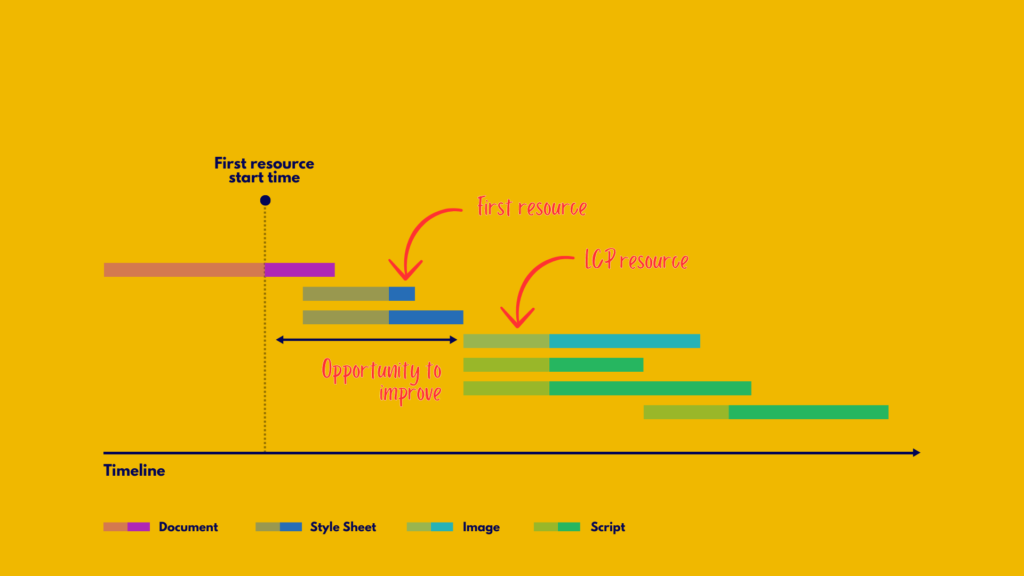
The goal here is to get your LCP resource loading as soon as possible, ideally right after the TTFB. But, there’s usually a bit of a delay before the browser gets things rolling.
A good rule of thumb is to have your LCP resource start loading at the same time as the very first resource on the page. If it starts loading later, there’s definitely room for improvement.
3. Reduce resource load duration
The goal here is to speed up the time it takes for your device to get the resource over the network. There are four main ways to do this:
- Shrink the resource size.
- Shorten the distance the resource travels.
- Reduce network traffic.
- Cut out network time completely.
a. Shrink the Resource Size
When it comes to improving your Largest Contentful Paint (LCP) score, the main culprits are usually images or web fonts. Here’s how to tackle both:
Image Optimization Tips
- Serve the Optimal Image Size: Make sure your images are just the right size for their use.
- Use Modern Image Formats: Formats like WebP, JPEG 2000, and JPEG XR are your friends.
- Compress Images: Shrink those file sizes without losing quality.
- Reduce Web Font Size: Smaller fonts load faster.
Fixing Image Performance Issues
Images often slow down your LCP, especially on mobile or desktop. Here’s how to speed things up:
- Compress and Resize: Smaller images load faster. Tools like ImageOptim can help for a few images, while Imagify is great for bulk optimization.
- Convert to New Formats: Google loves WebP, and so should you. Most WordPress plugins now support this format.
- Use Responsive Images: Different sizes for different devices. Elementor and other page builders make this easy.
- Exclude LCP Elements from Lazy-Loading: Lazy-loading is great, but not for your LCP element. Load it directly in the HTML.
- Use Static Images Instead of Sliders: Sliders are heavy; static images are light and fast.
PageSpeed Insights Audits
By optimizing your images, you’ll hit these PageSpeed recommendations:
- Serve images in next-gen formats.
- Properly sized images.
- Efficiently encode images.
- Avoid enormous network payload.
- Compress Text Files
Don’t forget to compress HTML, CSS, and JavaScript files. Compression formats like GZIP and Brotli can make a big difference. GZIP is widely supported, but Brotli is more efficient.
Enable GZIP on WordPress: Plugins like WP Rocket make this easy. Some hosts even enable it by default.
By doing this, you’ll address the “Enable text compression” recommendation from PageSpeed Insights.
b. Shorten the Distance
Want to speed up your website? Besides shrinking resource sizes, you can also cut down load times by getting your servers closer to your users. The best way to do that? Use a content delivery network (CDN).
Image CDNs are especially awesome because they not only shorten the distance your resources have to travel, but they also automatically shrink the size of those resources for you. It’s like hitting two birds with one stone!
But here’s a key point: while image CDNs are great for reducing load times, using a third-party domain to host your images can add an extra connection cost. Pre Connecting to the origin can help, but the best bet is to serve images from the same origin as your HTML document. Many CDNs let you proxy requests from your origin to theirs, which is a handy option to consider.
A CDN helps cut down the time between a user request and the server response, known as latency. The back-and-forth between the browser request and the server response is called the round trip time (RTT).
If your users are far from your server, it could take a while for all the assets (like images, JS, CSS files, videos) to load. High latency and RTT can slow down loading times and hurt your LCP score.
You’ve probably noticed how your server’s location affects your site’s performance. A CDN fixes this with a global network of servers. No matter where your users are, they’ll get the assets from the closest server. Simple as that.
Choosing a CDN can help you nail these PageSpeed recommendations:
- Serve static assets with an efficient cache policy.
- Enable text compression.
Just remember, a CDN will only help if it’s properly configured. Default settings might not be enough to boost performance as expected.
c. Reduce Network Traffic
Even if you’ve made your resource smaller and closer, it can still be slow if you’re loading a bunch of stuff at the same time. This is called network contention.
If you give your LCP resource a high fetch priority and start loading it ASAP, the browser will try to prevent other lower-priority resources from competing with it. But if you’re loading a lot of high-priority resources, it might still slow things down.
d. Cut Out Network Time Completely
The ultimate way to speed things up is to eliminate the network from the equation. If you serve your resources with a good cache-control policy, returning visitors will get those resources from the cache, making load times almost zero!
If your LCP resource is a web font, besides reducing its size, think about whether it needs to block rendering. Setting a font-display value other than auto or block ensures text is always visible during load, so LCP isn’t held up by another network request.
Lastly, if your LCP resource is small, consider inlining it as a data URL. This removes the extra network request, but remember, data URLs can’t be cached and might cause longer render delays due to decode costs.
4. Eliminate element render delay
To tackle LCP issues and ensure the Largest Contentful Paint (LCP) element loads quickly, follow these steps to avoid unnecessary LCP render delays.
a. Reduce or Inline Render-Blocking Stylesheets
Stylesheets from HTML markup can block the rendering of content that follows them. This is usually good because you don’t want unstyled HTML. However, if a stylesheet is too large and takes longer to load than the LCP resource, it can cause LCP load delays.
How to Fix This:
- Inline the Stylesheet: Embed the stylesheet directly into the HTML to avoid extra network requests. This is best for small stylesheets since inlined content can’t be cached for future visits.
- Reduce Stylesheet Size: Make the stylesheet smaller than the LCP resource to prevent it from being a bottleneck.
When it comes to JavaScript files, don’t forget to defer non-critical CSS too—basically, any CSS files that aren’t essential for rendering the page right away. This means changing their priority so they load after the most important content is already visible.
While you’re at it, make sure to inline the critical CSS—the stuff above the fold that needs to load super fast. This means identifying the critical CSS (or Critical Path CSS) and embedding it directly into the HTML.
If you’re using WordPress, here’s a quick rundown on how to do both:
- Extract and Inline Critical Path CSS (CPCSS): Use a generator tool to get this done. You can find one online.
- Load the Rest Asynchronously: Apply a pattern to load the remaining CSS classes asynchronously. Google has a great resource on this.
Also, avoid putting large chunks of non-critical CSS in the <head> section of your code.
For a quick fix on both critical and non-critical CSS, WP Rocket is your friend! It has features that make this process a breeze. Just enable the “Remove unused CSS” option, and the plugin will clean up the unused CSS from each page’s HTML.
Here are some tips to reduce your stylesheet size:
- Remove Unused CSS: Tools like Chrome DevTools can help you find and eliminate unused CSS rules.
- Defer Non-Critical CSS: Split your stylesheet into critical styles for the initial load and non-critical styles that can load later.
- Minify and Compress CSS: Reduce the transfer size of critical styles as much as possible.
By following these steps, you can improve LCP and achieve a better LCP score by minimizing load delays for the Largest Contentful Paint element.
b. Defer or inline render-blocking JavaScript
Adding synchronous scripts (those without async or defer attributes) to the <head> of your pages is almost never necessary and usually harms performance.
Optimize Your Scripts for Better Performance
- Avoid Synchronous Scripts: These can seriously slow down your page load.
- Inline Small Scripts: If JavaScript needs to run early, inline it to avoid delays from extra network requests. This helps your page render quickly.
- Use Async or Defer: For larger scripts, always use async or defer to keep them from blocking the rendering process.
Understanding Render-Blocking Resources
Certain JavaScript code and CSS stylesheets need to be downloaded by the user’s browser before the content on the page can be rendered. Here’s how it works:
A web browser starts parsing an HTML file and has to stop when it encounters a CSS or JavaScript file. It fetches that file before continuing to parse the HTML. This can slow down your website and hurt your LCP score.
How to Reduce Render-Blocking Resources
- Identify Blocking Resources: Figure out which resources are actually blocking rendering.
- Check Necessity: Determine if these resources are necessary. Sometimes websites load large bundles of JavaScript and CSS files that aren’t needed. For example, there might be leftover code that’s no longer used.
If a specific JavaScript function isn’t needed on a page, or the CSS can be downloaded later (because it’s not necessary to render the page’s content), there’s no need to force the user’s browser to download it.
c. Use server-side rendering
Server-side rendering (SSR) is when your server runs the client-side application logic and sends back a fully rendered HTML page. This can be great for optimizing Largest Contentful Paint (LCP).
- Benefits of SSR for LCP:
Discoverable Image Resources: Images are easily found in the HTML source.
No Extra JavaScript Requests: Your page content doesn’t need additional JavaScript to render.
- Downsides of SSR:
Extra Server Processing Time: This can slow down your Time to First Byte (TTFB). However, this trade-off is often worth it because you control server processing times, unlike the network and device capabilities of your users.
- Static Site Generation (SSG):
A similar approach is Static Site Generation (SSG), where HTML pages are pre-generated during a build step rather than on-demand. If your setup allows for prerendering, SSG is generally better for performance.
d. Break up long tasks
Even if you’ve optimized your JavaScript to avoid blocking rendering, it can still cause LCP delays. This often happens when pages load large JavaScript files that need to be parsed and executed on the browser’s main thread.
- Why This Matters:
- Main Thread Blocking: Even if your image resource is fully downloaded, it might have to wait for an unrelated script to finish executing before it can render.
- Image Rendering: All browsers render images on the main thread, so anything that blocks this thread can delay the rendering of your elements.
To avoid these LCP render delays, ensure your JavaScript files are as small and efficient as possible.
Optimize LCP and Maximize Your Website’s Potential with i2D Communications Limited
Understanding the importance of LCP for performance and user experience is crucial. By implementing these optimization techniques, you’ll significantly improve the LCP score on your websites.
Optimizing your Largest Contentful Paint (LCP) is key to meeting Google’s page experience standards and enhancing user satisfaction on your website. It also helps improve your site’s search engine rankings.
Start by contacting i2D Communications to identify any LCP issues on your website. Once you’ve pinpointed the problems, follow the tips in this guide to further optimize your LCP score.
If you’re not yet a customer, consider letting i2D Communications handle it for you. Our web development team can achieve an excellent LCP score for your site without you needing to adjust any settings. We automatically apply 80% of web performance best practices, leading to an immediate and visible improvement in your Core Web Vitals scores.
Additionally, you’ll no longer need to manage multiple web performance plugins. With i2D Communications, you only need one team to enhance your LCP score—no technical expertise required.

